
Advertising on Facebook is a highly effective way for businesses to reach new customers, stay connected with existing ones, and boost revenue to sustainable levels and beyond. The social network giant owns of the largest and most sophisticated advertising platforms in the world and plays an important role in the marketing strategies of millions of businesses worldwide. Throughout the years, Facebook has made gathered a gigantic user base and developed dozens of advanced advertising features to help businesses reach customers with pinpoint accuracy and reasonable costs.
One of the areas that the company has excelled in is measuring Facebook ad performance. Advertisers have access to a wide range of metrics that assess the performance of different aspects of their campaigns. While this is surely good news, it could also become a little confusing. How would you know which metrics to track and which ones to ignore? Let’s dive in deeper to learn more about performance measurements on Facebook.
In Facebook, you can run different kinds of campaigns, all of which are good for achieving certain objectives. You can create awareness campaigns focused on getting the word out about your brand, or conversion campaigns to entice warm audiences to become your customers. Facebook also provides many different performance metrics that measure how well your ads are doing in certain aspects. These Facebook Ad metrics are plentiful, and even though the platform assists you in tracking the right ones to a level, it’s really easy to get confused and focus on the ones that really don’t matter to you. There’s no such thing as “Good” or “Bad” performance metrics; You need to consider the context of your business and the goals you had in mind for running the campaign in the first place.
How to check Facebook performance reports
It’s actually very easy to review the performance of your campaigns. Your dashboard contains a table that contains your current campaigns and several columns which give you an overview of basic info (like delivery status) and results. By default, these column include:
- Results: How many times your ad has achieved your set objective
- Reach: The number of unique accounts that have seen your ad at least once
- Impressions: How many times your ads have been viewed by users on a screen
- Cost per result: The average cost of your ads compared to the generated results
- Amount spent: The total amount of money you’ve spent on your campaign
You can customize these columns to show your preferred metric. Click on the Columns drop-down menu in the bar above the table to view a list of preset options and select the ones you prefer. If you can’t find the metric you’re looking for, click on Customize Columns… to view the complete list of Facebook Ads performance metrics. This list is very extensive and contains a myriad of metrics you can choose from. There’s also a date selector at the top-right corner of your dashboard that lets you see results from your preferred time period. By toggling the Compare switch, you can use this date selector to compare results from two different time periods.
One of the best features of Facebook Ads Manager is the Breakdown option which gives you access to more advanced and in-depth performance reports and provides insight into each individual aspect of your campaigns. Foe example, you can break down your campaign by age and check how your ads have performed in different age groups. There are three main breakdown types:
- Delivery: Who and where your ad has been delivered to
- Action: What actions people have taken during or after seeing your ad
- Time: Sort ad data by time
Tracking and Analyzing Ad Performance
Tracking and analyzing ad performance is crucial for measuring the success of your Facebook advertising campaigns. It allows you to understand which campaigns are performing well, where improvements can be made, and how to optimize your budget allocation for maximum results:
Setting up Facebook Pixel and Conversion Tracking
To truly measure the performance of your Facebook ads, you’ll need to set up the Facebook Pixel and conversion tracking. The Facebook Pixel is a piece of code that you add to your website, which allows you to track conversions, build custom audiences, and retarget visitors. Conversion tracking, on the other hand, allows you to track specific actions taken on your website, such as a purchase or form submission.
Analyzing Ad Campaign Results
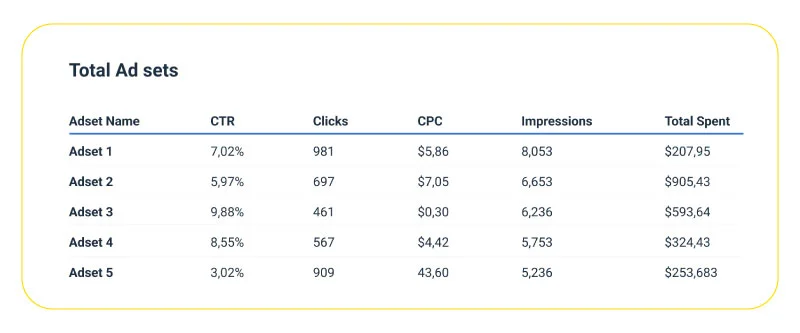
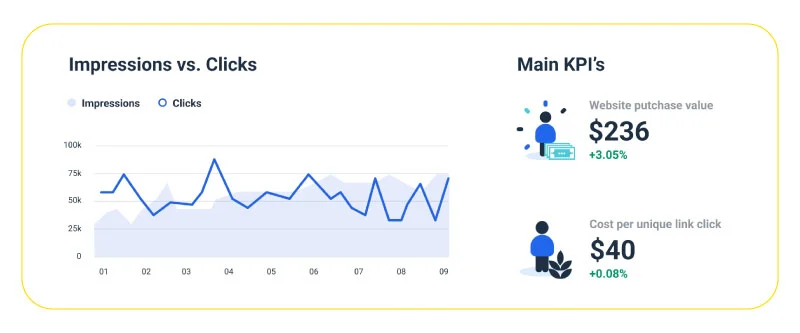
Once you have your Facebook Pixel and conversion tracking set up, it’s time to analyze your ad campaign results. In the Facebook Ads Manager, you’ll be able to see a wealth of data on your ad performance, including metrics like CTR, CPC, and conversion rate. Use this data to identify which ads are performing well and which ones may need to be tweaked or paused.
Optimizing Ad Performance and Budget Allocation
With the data from your ad campaign analysis, you’ll be able to make informed decisions about how to optimize your ad performance and budget allocation. This might include adjusting your targeting, creating new ad copy or visuals, or allocating more budget to high-performing ads.
Utilizing Third-Party Tools for Advanced Analysis
In addition to the built-in tools in Facebook Ads Manager, there are also third-party tools available that can provide even more detailed analysis of your ad performance. Some popular options include tools like AdEspresso, Smartly, and AdParlor. These tools can help you analyze data in new ways and make more informed decisions about your ad campaigns.
Essential Facebook ad performance metrics you need to track
Measuring the performance of your Facebook ad campaigns is crucial for making data-driven decisions and understanding the effectiveness of your advertising efforts. In order to properly measure your Facebook ad performance, it’s important to understand the different metrics available to you and what they represent.
Facebook provides a variety of metrics that can be used to evaluate the performance of your ads, including reach, engagement, and conversion metrics. Reach metrics measure the number of people who have seen your ad, while engagement metrics measure the level of engagement with your ad, such as the number of likes, comments, and shares. Conversion metrics, on the other hand, measure the number of people who have taken a desired action, such as making a purchase or signing up for a newsletter. These metrics will help you to understand how well your ad is performing in terms of visibility, engagement and conversion. Understanding how to interpret these metrics and how they relate to your business objectives is essential to properly measuring and optimizing your ad performance.
Though Facebook provides hundreds of granular metrics, there a some key performance indicators that you need to put more focus on to better evaluate and optimize your campaigns:
Impressions
When running brand awareness campaigns, a very important metric you need to track is impressions, which is the total amount of times your ads have been viewed on a screen. The formula is pretty simple: The more times your ads have been viewed, the higher awareness you’ve built. Visibility and grabbing audience’s attention is crucial when running awareness campaigns. Therefore, it’s better to pick the placements that increase your exposure and use creatives that are eye-catching.
Click-through rate (CTR)
As the name suggests, CTR measures the percentage of viewers who click on your ad after seeing it. While you also can view the total number of clicks on your ad, it’s important to evaluate your click-through rate since it better indicates the quality of your ad and how engaging it is. In many cases, CTR directly influences your costs. For pay-per-click (PPC) advertising, you’d want to achieve the highest possible number of clicks you can get compared to the number of impressions. The average CTR for Facebook Ads across all industries is 0.9% according to WordStream estimates.
Return on ad spend (ROAS)
Return on Ad Spend is one of the most important marketing performance metrics. It determines how much money you’ve gained from your advertising efforts on Facebook. It’s important to know that “good ROAS” is not definitive. It heavily depends on the channel you’re utilizing in your strategy and your vertical. Several other factors can also impact your criteria like margins, financial status, and operating costs. The campaign objective is another influencing element that you should consider when judging your ROAS. If you’re running ads on Facebook to build brand awareness and boost your visibility, your ROAS would obviously be much lower than with ads that focus on making sales. Generally speaking, try to aim for at least $4 ROAS (four times your original investment).
Engagements
Whenever someone has an interaction with your ad, it counts as an engagement. Naturally, there are quite a few ways people can interact with your ad, so engagement metrics could be broken down into the following:
- Likes
- Share
- Comment
- Reaction
- Click
Now, the objective of your campaign determines the engagement metrics you should put more focus on. For example, awareness campaigns have the goal of introducing your brand to new customers, so you should track the metrics that indicate how much your target audience has found your ads interesting, like comments, likes, and reactions. Following the best practices for writing an effective advertisement would be great help for recording high engagements. On the other hand, conversion metrics like clicks are more important when your run campaigns for grabbing purchases (like remarketing campaigns).
Cost per action (CPA)
For each Facebook campaign you run, there’s a certain desired action that you hope your target audience will take after viewing your ad. Tracking the total number of actions taken by viewers could be deceiving, because there’s no way you could know how efficient you’ve been when collecting those actions. Imagine you’ve recorded 500 actions with one of your ads, and 250 with a another similar one. 500 is bigger than 350 so the first ad has done better right? Well, what if the second campaign has costed you half the money? Keep in mind that CPA is not meaningful when your sample size is too small.
Conclusion
Not all performance metrics are going to help you optimize your Facebook ad campaigns. Contextualizing the data and insights Facebook provides is crucial when evaluating the performance of your ads, so you won’t waste your time on unimportant metrics. The key performance indicators vary depending on the type of campaigns you’re running, so remember to put your focus on the ones that really matter and utilize the most effect Facebook ad tips to maximize your return on investment.
FAQs
How do you know if a Facebook ad is performing well?
There are a lot of variable in play, and you should consider several important factors like the type of ad you’re running, the objective you have in mind for your ad, your budget, and expectations. While Facebook gives you tons of performance data, it’s crucial to evaluate your ad based on the metrics that are relevant to the context of your ad (format, type, optimization goal, etc.).
What metrics would you use to measure the success of Facebook ads?
It entirely depends on the type of campaigns you’re running. For example, when you’re running brand awareness, delivery metrics like reach and impressions are key performance indicators.


 Facebook Ads Spy Tool
 TikTok Ads Spy Tool