Facebook Ads benchmarks refer to the key performance indicators (KPIs) that help advertisers measure the success of their Facebook ad campaigns. Understanding these benchmarks is essential for optimizing your ads and achieving your advertising goals.

In this article, we will discuss the importance of understanding Facebook Ads benchmarks, and we will provide an overview of the benchmarks for Facebook Ads in 2024. Additionally, we will cover industry benchmarks, average Facebook Ads metrics, and conversion rates, as well as provide tips for optimizing your ads to achieve better results.
Understanding Facebook Ads Benchmarks
When it comes to Facebook advertising, benchmarks refer to the average or expected performance of ads within a specific industry or region. Understanding Facebook Ads benchmarks is crucial in evaluating the success of your advertising campaigns and making data-driven decisions.
Types of KPIs in Facebook Ads include click-through rates (CTR), conversion rates, cost per click (CPC), cost per action (CPA), and return on ad spend (ROAS). These benchmarks vary depending on factors such as industry, ad placement, target audience, and campaign objectives.

Factors that influence Facebook Ads benchmarks include the ad’s creative elements, the target audience, the bidding strategy, the timing and frequency of ads, and the ad relevance diagnostics. It is important to note that benchmarks can also vary over time as Facebook’s algorithms and user behavior change. Therefore, it is essential to keep track of the latest benchmarks to ensure your ads are performing optimally.
Facebook Ads Performance Benchmarks
Facebook Ads performance benchmarks refer to the standard metrics used to evaluate the effectiveness of Facebook Ads campaigns. It is essential to understand these benchmarks to measure the success of your Facebook Ads and optimize them for better performance. Here are some key aspects of Facebook Ads performance benchmarks:

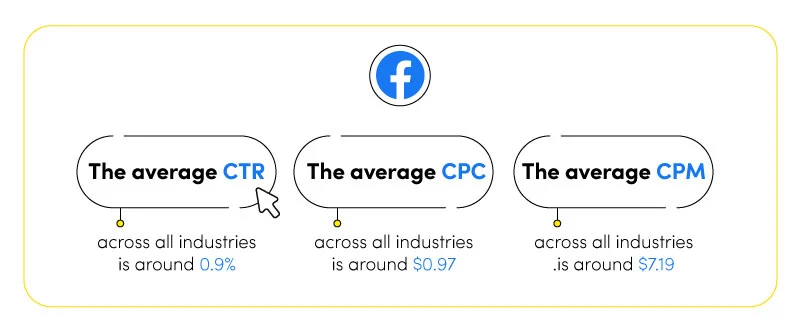
- Average Facebook Ads metrics: The average metrics for Facebook Ads performance include click-through rate (CTR), cost-per-click (CPC), cost per mille (CPM), and conversion rate. The average CTR for Facebook Ads across all industries is around 0.9%, while the average CPC is $0.97, and the average CPM is $7.19. We’ve also discussed what is a good ROAS for Facebook Ads in a separate article that we recommend you check out.
- Industry-specific benchmarks for Facebook Ads performance: Different industries have varying benchmarks for Facebook Ads performance, depending on factors such as competition and audience size. For example, the average CTR for the apparel industry is around 1.24%, while it is only 0.47% for the legal industry.
- Benchmarks for Facebook Ads conversion rates: Conversion rate is the percentage of people who took the desired action, such as filling out a form or making a purchase, after clicking on the ad. The average conversion rate for Facebook Ads is around 9.21%, while the benchmark varies for different industries.
It is crucial to monitor your Facebook Ads’ performance regularly and compare them against industry benchmarks to identify areas for improvement and optimize your ad campaigns for better results.

Here are some industry-specific benchmarks for Facebook Ads performance:
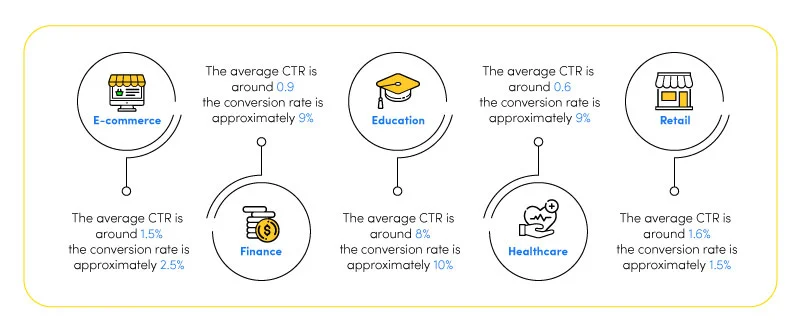
- Finance: Facebook Ads for finance have an average CTR of around 0.5%, with a conversion rate of approximately 9%.
- Education: The average CTR for education-related Facebook Ads is around 0.7%, while the conversion rate is approximately 13.5%.
- Healthcare: Facebook Ads for healthcare have an average CTR of around 0.8%, with a conversion rate of approximately 11%.
- Retail: The average CTR for retail-related Facebook Ads is around 1.6%, while the average conversion rate is approximately 3.2%.
It is important to note that these benchmarks are not set in stone and may vary depending on various factors such as your industry, audience demographics, and ad creative.
Additionally, benchmarks for Facebook Ads conversion rates are crucial in determining the effectiveness of your ad campaign. Conversion rate benchmarks for Facebook Ads vary by industry, but on average, they are around 9%. Factors such as ad targeting, ad format, and the quality of your landing page can affect your conversion rates.
By understanding Facebook Ads benchmarks, you can set realistic goals for your ad campaigns and continually optimize them to improve their performance.
Facebook Ads Benchmarks by Industry
Understanding industry-specific Facebook Ads benchmarks is crucial for developing an effective Facebook Ads strategy. Here is an overview of industry-specific benchmarks for Facebook Ads performance:
| Industry | Average CTR | Average CPC | Average Conversion Rate |
|---|---|---|---|
| Retail | 1.59% | $0.70 | 3.26% |
| Healthcare | 0.83% | $1.32 | 11% |
| Real estate | 0.99% | $1.81 | 10.68% |
| Education | 0.73% | $1.06 | 13.58% |
| Technology | 1.04% | $1.27 | 2.31% |
It’s important to note that these benchmarks are not fixed and can vary depending on various factors such as target audience, ad creative, and ad placement. It’s crucial to continuously monitor your ad performance and adjust your strategy as needed.
Facebook Ads Benchmarks 2024
As Facebook Ads continue to evolve, it’s important to stay up-to-date with the latest trends and predictions for upcoming Facebook Ads benchmarks. Here are some anticipated changes to Facebook Ads benchmarks in 2024:
- Increased focus on personalized advertising: With the rise of privacy concerns and the use of ad blockers, advertisers will need to focus on delivering more personalized and relevant ads to their target audience. This will likely result in higher engagement rates and more conversions.
- Emphasis on video ads: Video ads are becoming increasingly popular on Facebook, with studies showing that they have higher engagement rates than other types of ads. As a result, we can expect to see more emphasis on video ads in the coming years.
- More competition for ad space: With more businesses advertising on Facebook than ever before, competition for ad space is becoming increasingly fierce. This may lead to higher CPCs and a need for advertisers to be more strategic with their targeting and ad creative.
- Continued growth of mobile advertising: As more people use their mobile devices to access Facebook, we can expect to see continued growth in mobile advertising. Advertisers will need to ensure that their ads are optimized for mobile devices and that they are targeting the right audience.

By keeping these trends in mind and adapting to changes in the Facebook Ads landscape, advertisers can continue to achieve success and meet their marketing objectives.
Tips for Improving Facebook Ads Performance
To exceed Facebook Ads benchmarks and improve ad performance, consider the following tips:
- Define your target audience: Ensure your ads are being shown to the right people by creating audience segments based on demographics, interests, behaviors, and location.
- Create compelling ad content: Make sure your ad content is engaging and relevant to your target audience. Use visuals and text that capture their attention and encourage them to take action.
- Use effective CTAs: Include a clear and concise call-to-action (CTA) in your ad that prompts viewers to take the desired action, such as making a purchase or visiting your website.
- Optimize your landing pages: Ensure that the landing pages your ads direct viewers to are optimized for conversions. They should load quickly, be mobile-friendly, and have clear messaging and CTAs.
- Test and measure your ads: Continuously test and measure the performance of your ads, experimenting with different targeting options, ad content, and CTAs to improve results.

By implementing these tips, you can optimize your Facebook Ads performance and exceed industry benchmarks, helping you achieve your marketing goals.
Conclusion
Understanding Facebook Ads benchmarks is crucial for creating successful ad campaigns. By keeping track of industry-specific benchmarks and performance metrics, advertisers can identify areas for improvement and set realistic goals for their campaigns. It is important to remember that benchmarks can change over time, so staying up-to-date with the latest trends and predictions is essential. By implementing the best practices and strategies for optimizing Facebook Ads performance, advertisers can exceed benchmarks and achieve their advertising goals. With dedication and hard work, Facebook Ads can be a powerful tool for driving traffic, increasing conversions, and growing businesses.
FAQs
What is benchmark in Facebook ads?
In Facebook ads, benchmarks refer to the average metrics and performance indicators for ads in a particular industry or niche. These benchmarks can be used to compare the performance of your ads to industry standards and identify areas for improvement.
What is the industry benchmark for Facebook ads 2024?
The industry benchmark for Facebook ads in 2023 is currently unknown as it is difficult to predict future trends and changes in the digital advertising landscape. However, it is important for businesses to keep an eye on current benchmarks and stay informed of any potential changes or updates.
Why are Facebook ads benchmarks important?
Facebook ads benchmarks are important for several reasons. Firstly, they provide businesses with a clear understanding of how their ads are performing compared to industry standards. This can help businesses identify areas for improvement and adjust their ad strategy accordingly. Additionally, benchmarks can provide a baseline for setting realistic goals and expectations for ad performance.
Where can I find Facebook ads benchmarks for my industry or niche?
There are several resources available online that provide industry-specific Facebook ads benchmarks, including Facebook’s own Ads Manager platform and third-party marketing research companies. It may also be helpful to consult with industry experts or seek advice from a digital marketing agency.


 Facebook Ads Spy Tool
 TikTok Ads Spy Tool